feval
ypred = feval( mdl , Xnew1,Xnew2. Xnewn ) returns the predicted response of mdl to the new input predictors Xnew1,Xnew2. Xnewn .
Examples
Plot Different Categorical Levels
Fit a mileage model to the carsmall data set, including the Year categorical predictor. Superimpose fitted curves on a scatter plot of the data.
Load the data set and fit the model.
load carsmall tbl = table(MPG,Weight); tbl.Year = categorical(Model_Year); mdl = fitlm(tbl,'MPG ~ Year + Weight^2');
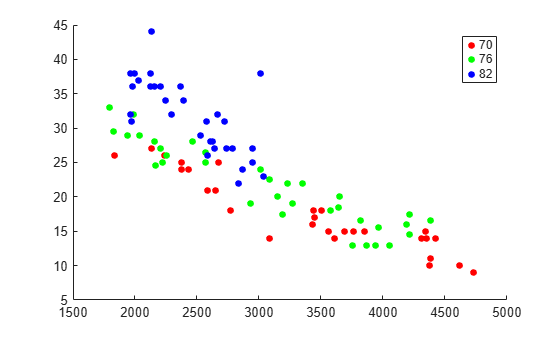
Create a scatter plot of MPG versus Weight , grouped by Year .
gscatter(tbl.Weight,tbl.MPG,tbl.Year,'rgb');
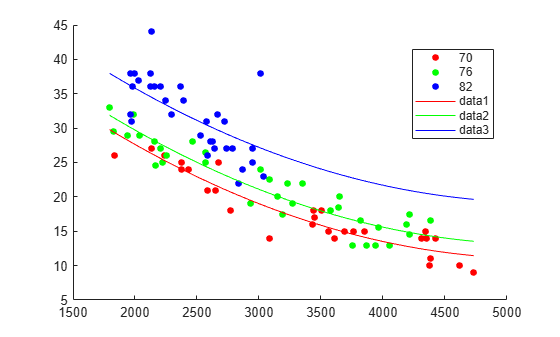
Plot curves of the model predictions for the various years and weights by using feval .
w = linspace(min(tbl.Weight),max(tbl.Weight))'; line(w,feval(mdl,w,'70'),'Color','r') line(w,feval(mdl,w,'76'),'Color','g') line(w,feval(mdl,w,'82'),'Color','b')
Input Arguments
mdl — Linear regression model object
LinearModel object | CompactLinearModel object
Linear regression model object, specified as a LinearModel object created by using fitlm or stepwiselm , or a CompactLinearModel object created by using compact .
Xnew1,Xnew2. Xnewn — New predictor input values
vector | matrix | table | dataset array
New predictor values, specified as a vector, matrix, table, or dataset array.
- If you pass multiple inputs Xnew1,Xnew2. Xnewn and each includes observations for one predictor variable, then each input must be a vector. Each vector must have the same size. If you specify a predictor variable as a scalar, then feval expands the scalar argument into a constant vector of the same size as the other arguments.
- If you pass a single input Xnew1 , then Xnew1 must be a table, dataset array, or matrix.
- If Xnew1 is a table or dataset array, it must contain predictors that have the same predictor names as in the PredictorNames property of mdl .
- If Xnew1 is a matrix, it must have the same number of variables (columns) in the same order as the predictor input used to create mdl . Note that Xnew1 must also contain any predictor variables that are not used as predictors in the fitted model. Also, all variables used in creating mdl must be numeric. To treat numerical predictors as categorical, identify the predictors using the 'CategoricalVars' name-value pair argument when you create mdl .
Data Types: single | double | table
Output Arguments
ypred — Predicted response values
numeric vector
Predicted response values at Xnew1,Xnew2. Xnewn , returned as a numeric vector.
Tips
- A regression object is, mathematically, a function that estimates the relationship between the response and predictors. The feval function enables an object to behave like a function in MATLAB ® . You can pass feval to another function that accepts a function input, such as fminsearch and integral .
- feval can be simpler to use with a model created from a table or dataset array. When you have new predictor data, you can pass it to feval without creating a table or matrix.
Alternative Functionality
- predict gives the same predictions as feval by using a single input argument containing all predictor variables, rather than multiple input arguments with one input for each predictor variable. predict also gives confidence intervals on its predictions.
- random predicts responses with added noise.
Extended Capabilities
GPU Arrays
Accelerate code by running on a graphics processing unit (GPU) using Parallel Computing Toolbox™.
This function fully supports GPU arrays. For more information, see Run MATLAB Functions on a GPU (Parallel Computing Toolbox) .
Version History
Introduced in R2012a
